![[construction icon]](./images/worker.gif)
![[construction icon]](./images/worker.gif)
A human cytome project aims at creating a better understanding of a cellular level of biological complexity in order to allow us to close the gap between (our) molecules and the intrahuman ecosystem. Understanding the (heterogeneous) cellular level of biological organisation and complexity is (almost) within reach of present day science, which makes such a project ambitious but achievable. A human cytome project is about creating a solid translational science, not from bench to bedside, but from molecule to man.
The exploration of the highly dynamic cellular structure and function (in vitro and in-vivo), evolving in a high dimensional space (XYZ and time) and whose quantitative analysis leads us into an even higher order feature space, poses an enormous challenge to our science and technology.
The goal of the framework concept is to create a Research Execution System (R.E.S.) for cytome wide exploration. To
create an analog (in-vitro and in-vivo) to digital (in-silico) workflow concept which can be applied to ultra large scale
research of human cytome-level processes to improve our understanding of cellular
disease processes and to develop better drugs (less attrition due to better
functional predictions).
Allow for managing a highly diverse quantitative processing of cellular structure and
function. Create in-silico multi-scale and multidimensional representations of cellular structure and
function to make them accessible to quantitative content and feature extraction.
The frontend technology mainly refers to optical systems, but CT, NMR, etc. can also be used for
molecular medical research.
A lot of research and development goes into integrating data from heterogeneous resources,
but due to the fact of a lack of workflow and process management at the content extraction level
this process is very cumbersome. The middleware (R.E.S.) to glue data generating tools easily to
corporate knowledge mining systems is missing (not only for cytome research).
My personal interest in cytomics, grew out of my own work on High Content Screening, as you can see in:
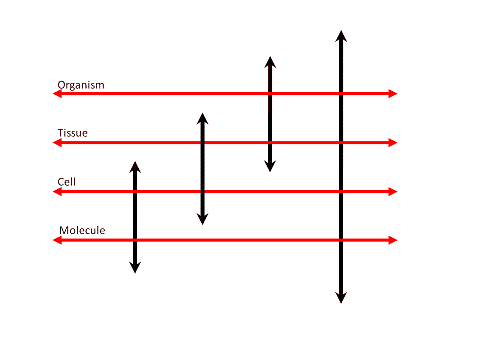
This document only provides basic ideas and thoughts on a framework to perform large scale cytome research, not yet with the concept of operations, user requirements or functional requirements, etc.. At the moment it does not yet provide a complete roadmap towards an entire system to achieve the goals outlined in the Human Cytome Project (HCP) concept. The potential impact of the human cytome on drug discovery and development is being discussed in Drug Discovery and Development - Human Cytome Project.
Let us now start with the thoughts and ideas for the framework. An entire organism is an anisotropic, densely packed, 4D grid (or matrix) of a high order of �recursive� information levels. We can study its structure and function at multiple levels, where the structure and function at each level is intertwined with over- and underlying structures and their function. The genotype and the phenotype both exist in a continuum of (bidirectional) interacting organizational levels.
Here I want to present and discuss some ideas on the exploration of the cytome and the conversion of the spatial, spectral and temporal properties of the cytome and its cells into their in-silico digital representation. It is a set of ideas about a concept which is still changing and growing, so do not expect anything final or polished yet. For readers with a good understanding of biotechnology and software engineering, the concepts in this article should be clear and easy to understand.
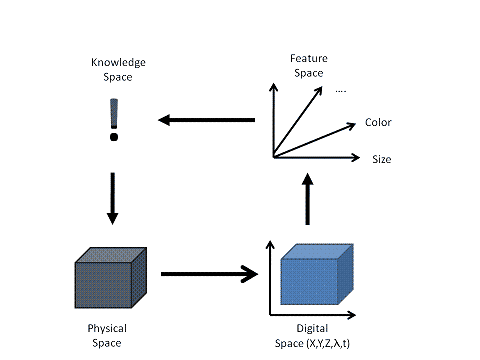
A modular and distributed framework should provide a unified approach to the management of the quantitative analysis of space (X, Y and Z), spectrum (wavelength) and time (t) related phenomena. We want to go from physics to quantitative features and finally come to a classification and understanding of the underlying biological process. We want to extract attributes from the physical process which are giving us information about the status and development of the process and its underlying structures.
First we have to create an in-silico digital representation starting from the analogue reality captured by an instrument. The second stage (after creation of an in-silico representation) is to extract meaningful parts (objects) related to biologically relevant structures and processes. Thirdly we apply features to the extracted objects, such as area and (spectral) intensity, which represent (relevant) attributes of the observed structure and process. Finally we have to separate and cluster objects based on their feature properties into biologically relevant subgroups, such as healthy versus disease.
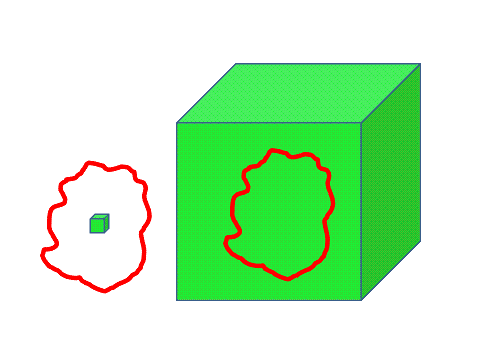
In order to quantify the physical properties of space and time of a biological sample we must be able to create an appropriate digital representation of these physical properties in-silico. This digital representation is then accessible to algorithms for content extraction. The content or objects of interest are then to be presented to a quantification engine which associates physical meaningful properties or features to the extracted objects. These object features build a multidimensional feature space which can be inserted into feature analyzers to find object/feature clusters, trends, associations and correlations.
The voxel can be used as the basic object from which we derive (inheritance) the higher-order structures, e.g. the cell, organ, organism. Its attributes are its spatial (X,Y,Z), temporal (t) and spectral (lambda) characteristics.
My personal interest has been to build a framework in which acquisition, detection and quantification are designed as modules each using plug-ins to do the actual work and which operate on objects being transferred through the framework. Content is delivered by sources and delivered to destinations by a concatenated flow management system. Operators are plugged into the process to extract and to transform the data content.
Data representing space, time and spectral sampling are distributed throughout the data management system to be processed. The data flow through the framework and are subjected to plug-in modules which operate on the data and transform the content into another content representing space, such as physics to features. The focus is not on the individual device to create the data or on individual algorithms, but on the management of the dataflow through a distributed system to convert spatial, spectral and temporal data into a feature (hyper-) space for quantitative analysis.
The software
framework manages the entire flow and transformation of data from physics to
features, like a ball which is thrown from player to player. As long as digital
information is transferred from module to module, it is nothing more than a
chunk of data whose actual data layout is only important for those modules
which act upon its data content. The dimensionality of its content (XYZ,
spectral, time) only matters for those modules which have be aware of it for
extracting content in the process from converting physics into features and
finally attributing a meaning to the events being observed.
Up- and downscaling of cell-based research is dynamically managed by the system as the scale of processing does not require a change in basic design. Expanding and collapsing data and feature dimensionality is a dynamic process in itself and leading to a continuously variable exploration system. Methods and algorithms for content extraction and feature attribution are overloaded for a multiplicity of data types and dimensionality.
I will mostly focus on molecular imaging technology, but the basic principles should be applicable on any digitized content extraction process. Images are digital information matrixes of a higher order; they only become images as such when we want to look at them and have to transform them into something which is meaningful for our visual system. Visualization provides us with a window on the data content, but not necessarily on the data as such.
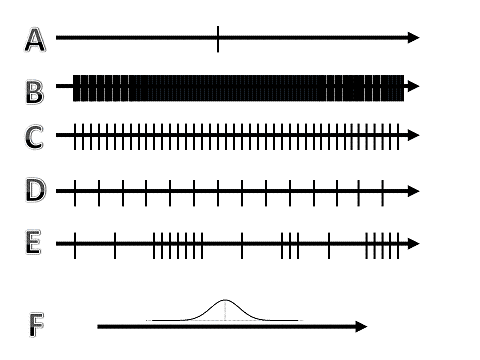
Figure 4: Sampling density of dimensions. Dimensions can be sampled continuously, discrete, equidistant or anequidistant, with a constant or a variable interval. |
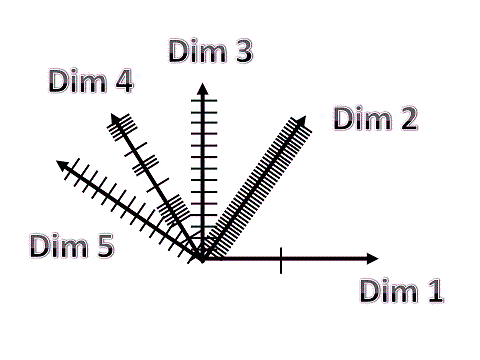
Figure 5: An example of (continuously) variable sampling (CVS) of 5 dimensions, with each dimension, either spatial (X, Y, Z), spectral (lambda) or temporal (time). |
We want to extract from the sample its structure and its dynamics or the flow of its structural changes through time. When applying digital imaging technology to a biological sample, a clear understanding of the physical characteristics of the sample and its interaction with the �sampling� device is a prerequisite for a successful application of technology.
The basic principle of a digital imaging system is to create a digital in-silico representation of the spatial, temporal and spectral physical process which is being studied. In order to achieve this we try to let down an equidistant sampling grid on the biological specimen. The physical layout of this sampling grid in reality is never a precise isomorphic cubical sampling pattern. The temporal and spectral sampling inner and outer resolution is determined by the physical characteristics of the sample (electromagnetic spectral range and spectral sampling layout) and the interaction with the detection technology being used.
The instrument which converts the spatial (scale, dimensions), spectral (electromagnetic energy, wavelength) and temporal continuum of the sample into its digital representation allows us to take a view on biology beyond the capacity of our own perceptive system. It rescales space, spectrum and time into a digital representation accessible to human perception (contrast-range, color) and ideally also to quantification. Instruments rescale spatial dimensions, spectral ranges and time into a scale which is accessible to the human mind. The digital image acts as a see-through window on a part of the physical properties of the biological sample, not on the instrument as such.
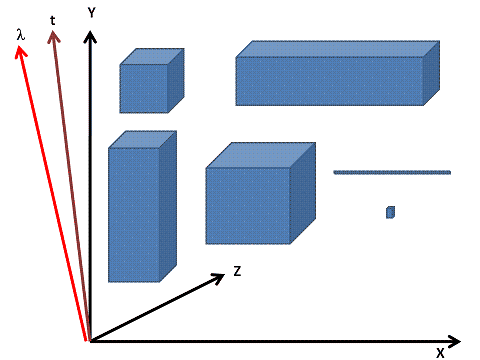
We want to insert a probe system into the sample which changes its state according to the physical characteristics of the sample. A probe is in general a dual system, a structure/function reporter on one side and an appropriate detector on the other side. The changes in the probe system are ideally perfectly aligned in a spatial-spectral and temporal space with the physical properties of the sample itself in space and time. Each probe system senses the state of the specimen with a finite aperture and so provides us with a view on the biological structure. All sensing is done in a 5 dimensional environment, in 3D space, spectrum (wavelength) and time. It is the inner an outer resolution of our sampling which changes. When we do 2D imaging, this is the same as 3D with the 3rd dimension collapsed to one layer, but due to the Depth of Focus (D.O.F.) of the detection system we use, this represents a physical Z-slice.
In the spectral domain we also probe electromagnetic energy along the spectral axis with a certain inner and outer resolution. We slide up and down the spectral axis within the spectral limits of the probing system, which transforms analogue electromagnetic energy into its digital representation. A single CCD camera probes the visible spectrum (and beyond) in one sweep, with a rather bad inner resolution. A 3CCD camera uses 3 probes to do its spectral sampling and gives us a threefold increase in inner resolution. Increasing or decreasing the density of the spectral sampling is only a matter of spectral dynamics. By using n cameras (or PMTs, etc.), each individually controlled (spectral) we can expand or collapse our spectral inner and outer resolution. We tend to use �spectral imaging� for anything which samples the visible spectrum with more than the spectral resolution of a 3CCD camera. Up-and downscaling our spectral sampling from broad to narrow, parallel or sequential, continuous or discontinuous is a matter of applying an appropriate detector array. A system can manage 1 to n spectral probing devices such as cameras,PMTs (or a spectral filter in front of a single detector), NMR, CT, etc.each sampling a part of the spectrum and spatially aligned allows probing the spectrum in a dynamic way.
The time axis is also probed with a varying temporal inner and outer resolution and depending on the characteristics of the detection device; the time-slicing can be collapsed or expanded. Time can be sampled continuously or discontinuously (time-lapse). We can expand or collapse the temporal resolution of the detector in order to capture (temporal integration) weak signals or shorten the time-slicing down to the minimum achievable with a given detector.
In order to compensate for sensitivity deficits of a detector, three strategies for improvement can be followed, but all three decrease the sampling resolution. Spatial, spectral and temporal signal integration can be used by expanding the physical scale of capturing along the spatial, temporal or spectral axis or in combinations. Using a B/W camera instead of a 3CCD camera is a way of spectral integration, but gives a threefold reduction in spectral sampling.
The result of the detection is a 5-dimensional system expanding or collapsing each dimension (XYZ, lambda, time) according to the requirements of exploration. The device and its components attached to the exploration core, imposes the inner and outer resolution limits upon the system. In-silico these are only high-order matrix arrays representing a 5D space. We could call this a continuously variable in-silico representation.
The inner and outer resolution of the probing system is determined by the physical XYZ sampling characteristics of the sampling device, such as its point spread function (PSF). For a digital microscope the resolving power of the objective (XYZ) and its depth of view/focus are important issues in experimental design and determining the application range of a device. The interaction of the detection device with the image created by the optics of the system such as Nyquist sampling demands, distribution of spectral sensitivity, dynamic range, also plays an important role.
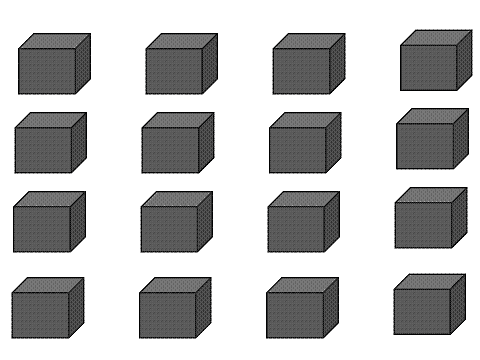
In order to increase and improve the extraction of content from our experiments, we try to increase their information density by multiplexing. To increase the throughput of exploration we try to do multiple experiments simultaneous to obtain multiple readouts at once. We miniaturize the experiments (multi-well plates, arrays) and we use biological entities which can be multiplexed in relatively small volumes (cells, tissue samples). We place multiple molecular structural and/or functional markers or labels into each biological unit (labeled molecules, structural contrast), so we can make functional and structural cross-correlations between biological events. The more events and structures we can explore in parallel, the more chance we have to detect potential meaningful events (shotgun, grid, and mesh or spider web type exploration). From each structural or functional label we extract multiple attributes as quantitative features. It is the choice of the appropriate markers and their features which are co-changing with functional attributes (cell division, apoptosis, cell death �) which is open for exploratory research.
Arrays are actually a type of miniaturized assays; they allow us to do more experiments on a smaller footprint. The exploration of samples is organised in an array-pattern (in general 2D due to technical limitations), ranging form a single tissue slice on a glass slide up to a large scale grid of for instance a cell or tissue expression arrays. Biological samples, up to tissue samples are small enough to allow for multiplexing experiments and they do not require large amounts of reagents in huge containers. Multiplexing experiments with entire elephants would be somewhat cumbersome, but DNA, protein, cells and parts of tissue nicely fit into our instruments. Scaffold cultures would allow us to use the 3 rd dimension if we can properly capture its content. Dynamic scaffold culturing, would allow us to disassemble the culture for manipulation or content exploration and reassemble them for continuation of the experiment (the ultimate scaffold culture is the organism itself).
DNA and
protein arrays are arrays of the first degree, as each sample in an array in
itself provides us with a scalar readout; there is no further spatial
differentiation. Cell arrays are of the second or third degree, depending on
the content (how many cells per array coordinate) and the resolution of the
readout. In an array of the second degree each array coordinate is in itself an
array as it is not a homogeneous sample (multiple cells), but readout
resolution is limited to the sub elements. In an array of the third degree each
of the sub elements is also compartmentalized (e.g. tissue arrays, sub-cellular
organelles, nuclear organization) and each array coordinate is explored at
sufficient resolution. By using arrays with multiple cells at each coordinate,
we can create readout cascades at multiple readout resolutions. This way we can
combine speed and simplicity for a quick overview and switch to more detail, to
find out about cellular heterogeneity and/or sub-cellular compartmentalization.
At each
array position we can add additional spatial, spectral and temporal
multiplexing strategies. Spatial multiplexing in arrays is done in cell based
assays or bead assays. Spectral multiplexing is done by using multiple spectral
labels, either static or by using spectral shift signalling
(dynamic spectral multiplexing). Temporal multiplexing is done by sequential
readouts at each array position to study dynamics or kinetics. By combining
arrays with multiplexing we can increase the content readout of experiments. By
combining DNA-, RNA-, protein-, cell- and tissue arrays with each other we can
also multiplex information from different biological processes, e.g. massive
parallel RNAi transfection of stem cells.
When we construct arrays with compartmentalized elements, we can up- and downscale our
exploration without the need to redo an entire experiment and so extract more
content from the experiment when wanted. The experiment is arranged and its
content is extracted in a way like Russian dolls fit into each other. When the
array consists of living cells or tissue, we can add the time dimension to our
experiment and create a 4D array for experimental multiplexing.
The granularity or density of the array pattern is determined by the experimental demands and
upstream and downstream processing capacity. Of course the optical
characteristics of the sample carrier (glass, plastic) will determine the
spatial sampling limits in its inner and outer resolution. The optical and
mechanical characteristics of the device used to explore the (sub) cellular
physical domain will also lead to a spatial, spectral and temporal application
domain. The coarse grid-like pattern of samples on a sample carrier is being
explored at each array position at the appropriate inner and outer resolution,
within the optical physical boundaries of the device used to capture the data.
The outer resolution barrier of the individual detector in space and time is
extended by both spatial and temporal tiling at a range of intervals. Spectral
multiplexing is being done by using spectral selection devices with the
appropriate spectral characteristics for the spectral profile of the sample.
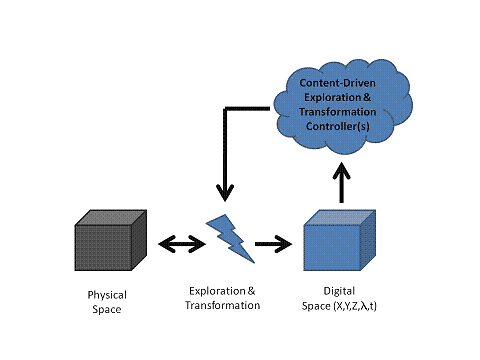
The detection cascade is not a one way passive flow of events, but we can place content-driven feedback systems into the dataflow. Adaptive content generation manages a source content driven digitalization process. Active feedback and control depends on the degree of automation and flexibility of the detection system. The spatial content capturing can be driven by a plug-in which controls the spatial sampling in order to sample within the physical boundaries of a sample (e.g. adaptive tissue scanning in 2D or 3D and beyond). A plug-in is docked into the system to modify its behavior and make it respond to content changes. The decision process can be implemented, based on a set of rules implemented as a neural network, fuzzy logic or whatever is appropriate. Spatial, spectral and temporal events can drive the process to create a content-driven acquisition process. Feedback loops cross the dimension and scale boundaries, a spectral change can drive a change in spatial layout, etc. A content driven time-lapse will change its temporal pacing whenever a meaningful event is detected and allow for aniso-temporal sampling. An acquisition system can be equipped with an active search plug-in making it search for interesting regions at low resolution and switching to high resolution for spectral and/or time-slicing. Liquid dispensers, incubators, robot arms and other automated components can be controlled by a content driven control system.
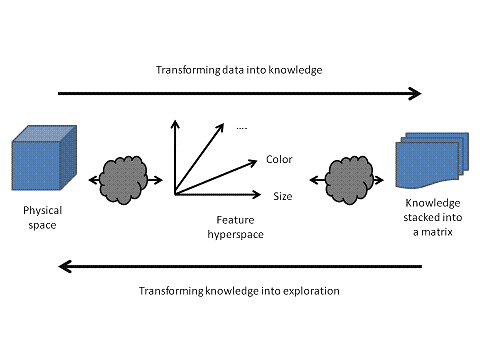
Figure 9: Transform physical data to knowledge. Interconnected actors, systems or modules plugged into a process manage the forward transformation from data into knowledge and vice versa. |
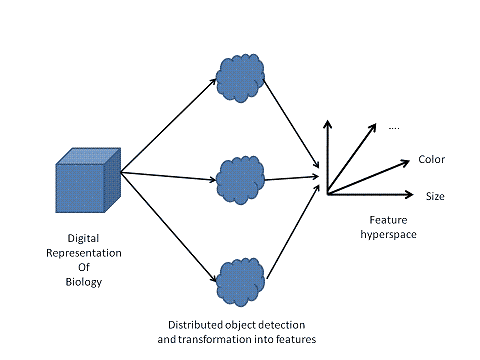
Figure 10: Distributed transformation of input into features. As with all parts of the transformation pathway from physics to knowledge, the transformation into features deploys a distributed and interconnected processing system. |
Robust operating algorithms for object extraction are a prerequisite for a large scale endeavor. A semi-interactive approach is not acceptable for large volume processing. The challenges are enormous as robust unattended large scale object extraction is still not achieved in many cases. The failure rate of the applied object extraction procedures must be less than 1 to 0.1 percent if we are to rely on large scale automated exploration of the human cytome.
The detection of appropriate objects for further quantification is done either in-line within the acquisition process or distributed to another process dealing with the object extraction. Objects should be aligned with biological structures and processes. The pixel or voxel representation in-silico however is basically �unaware� of this meta-information about how the digital density pattern was created. The physical meaning of one data point will change depending on the spatial, temporal and spectral sampling and its inner and out resolution. The digital data build a (dis-)continuous representation of a spatial, spectral and temporal continuum which expands or collapses in an anisotropic way.
The content of the data is of no meaning for a data-transfer system as such, it only
transfers the content throughout its dependencies. Analytical tools operating on
the data content need to be informed about the layout of the data. Detection
and quantification algorithms act on the digital information as such and only
the back-translation into physical meaningful data requires a back-propagation
into the real-world layout and dimensions. The resulting discrete
representation of the sampled spatial, spectral and temporal grid at each array
position is being sent to a storage medium (file system, database�) to provide
an audit trail for quality assessment and data validation.
The selected objects are sent to a set of quantification modules which attaches an array of quantitative descriptors (shape, density �) to each object. We expand or collapse the content extraction according to their meaning for describing the biological phenomenon. Content extraction is being multiplexed, just as the experiment itself.
Objects belonging to the same biological entity are tagged to allow for a linked exploration of the feature space created for each individual object. The resulting data arrays can be fed into analytical tools appropriate for analysing a high dimensional linked feature space or feature hyperspace. The dynamics of the attributes of the biological system need not be aligned with the features we extract to create a quantitative representation. An attribute change and a feature of which we expect to represent this change may not be perfectly aligned, so we may only capture a fraction of the actual change itself. Changes may occur in a combined spatial-spectral and temporal space of which we can only capture certain features, such as length, intensity, volume, etc.
The feature sets can be fed into analytical systems for statistical data analysis, exploratory statistics, classification and clustering. Classification performance can be improved by combining several independent classifiers on the feature sets. The resultant vector of a multiparametric quantification may point in the most meaningful direction to capture a change. Both parametric and nonparametric approaches to classification can be used.
We often try to do our experiments on a non-changing background (genetic homogeneity) or average the background noise by randomisation. What we call noise is in many cases not well understood but maybe meaningful dynamic behaviour of a system? Trying to describe changes relative to underlying oscillations, e.g. cell cycle, by using dynamic background reporters could help to find dynamic correlations between events.
As the framework is meant to be part of a global information processing structure I will
give some definitions about the path from data to intelligence.
Data is not knowledge. Data means factual information (measurements or statistics) used as a basis for reasoning,
discussion, or calculation. Information means the communication or reception of knowledge
or intelligence. Knowledge is the condition of knowing something gained through experience
or the condition of apprehending truth or fact through reasoning. Intelligence is
the ability to understand and to apply knowledge.
A framework to extract content from poly-dimensional systems must be embedded in a
toolchain or tool-web which deals with the transformation of data into knowledge and finally
understanding (or intelligence), otherwise it only leads into a data graveyard. We have to avoid
that the generated data become trapped in hierarchical silos,
restricted by structure, location, systems and semantics.
Providing tools to scientists to explore the vast amounts of dispersed
data is one of the most important challenges we have to deal with. Building those tools and
embedding content extractors into these frameworks could help us to deal with highly complex data.
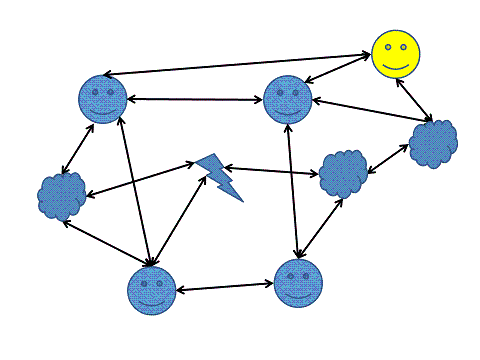
Figure 11: From MBWA to MBBA into creating a Research Execution System (RES). As people and systems create an interconnected process web, transforming their data and knowledge into digital space allows for the digital equivalent of MBWA. The participants of the process in the scheme are the digital participants or their digital counterparts. |
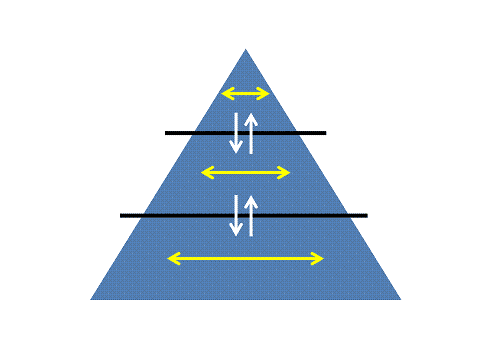
Figure 12: The orthogonal flow of data and its conversion and condensation into knowledge The data which flow through an organism and an organization need to be interconnected interrelated and seamlesly condensed into summarising feature sets recursively opening windows into over- and underlying levels of organization, the so called Matryoshka principle. The basis of the pyramid consists of data, the intermediate level of features and the highest level of condensed knowledge. |
Creating knowledge and understanding out of observations and datasets requires a complicated web of interactions
and transformations. Gathering tons of data without taking care of the transformation process is a waste
of time, money and energy. Both an organization as well as a model of an organism need to be established in a way which
interconnects all its subparts into one dynamic and evolving organizational architecture creating knowledge. What we call
Business Intelligence (BI)
and knowledge management is in most cases only a shadow of what could be achieved by constructing an entire organization (such as
required for an endeavour like the Human Cytome Project) or organism model with a seamles and continuously transforming flow towards
creating knowledge right from the start.
Within the data lives the knowledge, albeit untransformed and unconnected. The organisation and its physical and digital participants
are the actors which need to cooperate in an integrated and mutual enabling way to create knowledge far more efficient than is done now.
The core of the system are the transformation modules with at each node in the web an intermediate representation of the
transformation step result, branching and debranching according to the need of the observer. In this web, man and machine are both
regarded as participants, albeit with different roles and responsibilities in this dynamic and evolving collaboration.
Efficiently managing the creation of knowledge requires a close integration of an entire organization. One of the most successful research management techniques is Management By Walking Around (MBWA) when someone with both an eagle view and an in-depth understanding of what is going on in research and development collects data by visiting his or her scientists on a regular basis.
Nowadays research organisations have become too large for MBWA to be practical. With modern technology we could create the digital equivalent by creating Management By Browsing Around (MBBA). This can provide (research) management with frequent, rapid, and relevant feedback from floor to ceiling of a large organisation operating on a global scale. A Research Execution System (R.E.S.) is one component in the closed feedback and control loop which allows us to run large research organisations on a global scale and stay informed about research process progress (or failure).
For those readers who are familiar with the principles of project management (e.g.PMBOK),
this document is part of the project initiation process.
The Project Management Institute (PMI) has identified nine topic areas to define
the scope of project management knowledge as follows: integration, scope, time, cost, quality, human resources,
communications, risk, and procurement.
For those readers who are interested in a methodology to implement the system under consideration (the software), I can recommend the Guide to the Software Engineering Body of Knowledge. For project management principles I can recommend the PMI Project Management Body of Knowledge. The choice of which development process model (Agile, Extreme Programming, RUP, V-Model,�.) to use to develop the system under consideration is beyond the scope of this document and it is left to the reader to decide (see SEI CMMI). For more information on software engineering you can read my webpage on Software for Science.
I am indebted, for their pioneering work on automated digital microscopy and High Content Screening (HCS) (1988-2001), to my former colleaguas at Janssen Pharmaceutica (1997-2001), such as Frans Cornelissen, Hugo Geerts, Jan-Mark Geusebroek, Roger Nuyens, Rony Nuydens, Luk Ver Donck and their colleaguas.
Many thanks also to the pioneers of Nanovid microscopy at Janssen Pharmaceutica, Marc De Brabander, Jan De Mey, Hugo Geerts, Marc Moeremans, Rony Nuydens and their colleagues. I also want to thank all those scientists who have helped me with general information and articles.
My webpages represent my interests, my opinions and my ideas, not those of my
employer or anyone else. I have created these web pages without any commercial
goal, but solely out of personal and scientific interest. You may download,
display, print and copy, any material at this website, in unaltered form only,
for your personal use or for non-commercial use within your organization.
Should my web pages or portions of my web pages be used on any Internet or
World Wide Web page or informational presentation, that a link back to my website (and
where appropriate back to the source document) be established. I expect at
least a short notice by email when you copy my web pages, or part of it for
your own use.
Any information here is provided in good faith but no warranty can be made for
its accuracy. As this is a work in progress, it is still incomplete and even
inaccurate. Although care has been taken in preparing the information contained
in my web pages, I do not and cannot guarantee the accuracy thereof. Anyone
using the information does so at their own risk and
shall be deemed to indemnify me from any and all injury or damage arising from
such use.
To the best of my knowledge, all graphics, text and other presentations not
created by me on my web pages are in the public domain and freely available
from various sources on the Internet or elsewhere and/or kindly provided by the
owner.
If you notice something incorrect or have any questions, send me an email.
Email: pvosta at cs dot com
First on-line version published on 9 Jan. 2005, last update on 24 July 2008.
The author of this webpage is Peter Van Osta, MD.
Private email: pvosta at gmail dot com
Mobile: +32 (0)497 228 725
Fax: +32 (0)3 385 39 21