The use of a light microscope for the quantitative analysis of specimens
requires an understanding of: light sources, the interaction of light with
the desired specimen, the characteristics of modern microscope optics,
the characteristics of modern electro-optical sensors (in particular, CCD
cameras), and the proper use of algorithms for the restoration, segmentation,
and analysis of digital images. All of these components are necessary if
one is to achieve the accurate measurement of analog quantities given
a digital representation of an image.
This webpage in general handles about the optimalisation of the image
acquisition, in order to minimise its contribution to the total variance of
the experiment.
The contribution of a biological system to the observed variance of a
measurement is in the order of about 15 percent (but may vary in different
experimental settings). It is very important to obtain an estimate of the
variability of the experiment, by carrying out a pilot study.
With proper settings for the image acquisition, the contribution of the image
acquisition to the observed variance can be reduced to about 1 percent.
Varianceobserved=Variancebiological+Varianceestimator
Observed Coefficient of Variation2=CV2observed=
CV2biological+CV2estimator
The first part of this webpage handles the optimalisation of the spatial resolution (inner resolution) and the second part handles the optimalisation of the dynamic range of the system.
Resolution | Sampling density | Correction of image defects | Background correction | Noise reduction
The rules for choosing the sampling density when the goal is image
analysis, as opposed to image processing (visualisation), are different.
For image processing
the Nyquist sampling rate is already sufficient,
but visualising small details alone is not enough for image analysis.
The fundamental difference is that the digitization of objects in an
image into a collection of pixels introduces a form of spatial quantization
noise. This leads to the following results for the choice of sampling
density when one is interested in the measurement of an area.
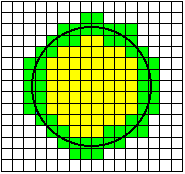
When a randomly placed (circular) cell is digitized, one possible
realization is shown in the image above. The equation for generating the cell
is where R is the radius of the cell. The terms ex and ey
are independent
random variables with a uniform distribution over the interval (-1/2, +1/2).
They represent the random placement of the cell with respect to the periodic
(unit) sampling grid of the CCD camera.
Given small variations in the center position
(ex, ey) of the circle, pixels
that are colored green will always remain part of the object and pixels that are
colored white will always remain part of the background. Pixels that are shown
in blue may change from object to background or vice-versa depending on the
specific realization of the circle center (ex, ey)
with respect to the digitizing grid of the CCD camera.
The unbiased algorithm for estimating area involves simple pixel counting.
To find out what effect the finite sampling density has on the area estimate
let us look at the coefficient-of-variation of the estimate (CV), the
CV = sigma / mu
where sigma is the standard deviation of the estimate of the area and mu is
the average estimate over an ensemble of realizations.
The formula to describe CV is shown below. The diameter of the cell is D
and the size of a camera pixel is s x s, then the sampling density is Q = D/s.
Each of the pixels in the blue region above can be part of the object with
probability p and part of the background with probability (1 - p) and
the decision for each pixel is independent of the other neighboring pixels in
the blue region. This, of course, describes a binomial distribution for the
pixels in that region. The probability of a single pixel belonging to the
object is:
p = 1 / 2 - 1 / (2 * Q )
We can now write down the formula for the coefficient of variation, ie. the
accuracy with which the area is being measured given a finite sampling density:
![]()
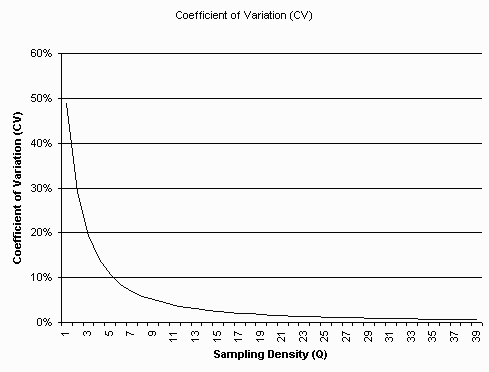
Graph of C.V. as a function of Q. The C.V. is less than 1 percent above
a sampling density (Q) of 30 samples (pixels) per object diameter (SI unit, eg. micrometer).
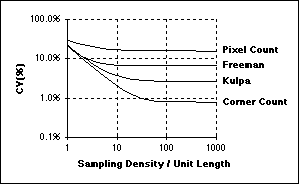
Assuming square sampling and algorithms for estimating length based upon the Freeman
chain-code representation, the Coefficient of Variation (CV) of the length measurement
is related to the sampling density per unit length as shown in the figure above.
The curves in this figure were developed in the context of straight lines but similar
results have been found for curves and closed contours.
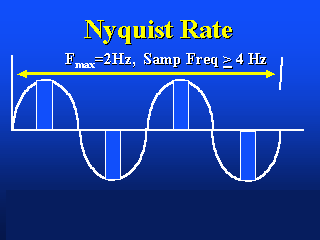
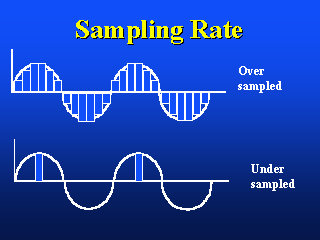
The image on the left shows the appropriate Nyquist sampling frequency, the image
on the right shows over- and undersampling.
Researchers using a CCD camera in conjunction with a microscope desire to work at the maximum possible spatial resolution allowed by their system. In order to accomplish this, it is necessary to properly match the magnification of the microscope to the CCD.
The first step in this process is to determine the resolving power of the microscope. The ultimate limit on the spatial resolution of any optical system is set by light diffraction; an optical system which performs to this level is termed "diffraction limited." In this case, the spatial resolution is given by:
d = 0.61 x lambda / N.A.
where d is the smallest resolvable distance, lambda is the wavelength of light being imaged, and N.A. is the numerical aperture of the microscope objective. This is derived by assuming that two point sources can be resolved as being separate when the center of the airy disc from one overlaps the first dark ring in the diffraction pattern of the second (the Rayleigh criterion).
It should further be noted that, for microscope systems, the numerical aperture to be used in this formula is the average of the objective's numerical aperture and the condenser's numerical aperture. Thus, if the condenser is significantly underfilling the objective with light, as is sometimes done to improve image contrast, then spatial resolution is sacrificed. Any aberrations in the optical system, or other factors which adversely affect performance, can only degrade the spatial resolution past this point. However, most microscope systems do perform at, or very near, the diffraction limit.
The formula above represents the spatial resolution in object space. At the detector, the resolution is the smallest resolvable distance multiplied by the magnification of the microscope optical system. It is this value that must be matched with the CCD.
The most obvious approach to matching resolution might seem to be simply setting this diffraction-limited resolution to the size of a single pixel. In practice, what is really required of the imaging system is that it be able to distinguish adjacent features. If optical resolution is set equal to single pixel size, then it is possible that two adjacent features of like intensity could each be imaged onto adjacent pixels on the CCD. In this case, there would be no way of discerning them as two separate features.
Separating adjacent features requires the presence of at least one intervening
pixel of disparate intensity value. For this reason, the best spatial resolution
that can be achieved occurs by matching the diffraction-limited resolution
of the optical system to two pixels on the CCD in each linear dimension.
This is called the Nyquist limit.
Nyquist frequency: The highest frequency that can be reproduced
accurately when a signal is digitally encoded (e.g. CCD camera) at a given sample rate.
Theoretically, the Nyquist frequency is half of the sampling rate.
For example, when a digital sound recording uses a sampling rate of 44.1kHz, the Nyquist
frequency is 22.050kHz. If a signal being sampled contains frequency components that
are above the Nyquist limit, aliasing will be introduced in the digital representation
of the signal unless those frequencies are filtered out prior to digital encoding.
Expressing this mathematically for a CCD camera mounted on a microscope we get:
(0.61 x lambda / N.A.) x Magnification = 2.0 x (pixel size)
Let's use this result to work through some practical examples.
M = (2 x 6.8) / (0.61 x 0.5 / 1.3) = 58
M = (2 x 15.0) / (0.61 x 0.5 / 1.3) = 128
It should be kept in mind that as magnification is increased and spatial
resolution is improved, field of view is decreased. Applications which require
both good spatial resolution and a large field of view will need CCDs with
larger numbers of pixels.
It should also be noted that increasing magnification
lowers image brightness on the CCD. This lengthens exposure times and can
limit the ability to monitor real time events.
If one is interested in image processing, one should choose a sampling density based upon classical signal theory, that is, the Nyquist sampling theory. If one is interested in image analysis, one should choose a sampling density based upon the desired measurement accuracy (bias) and precision (CV). In a case of uncertainty, one should choose the higher of the two sampling densities (frequencies).
Reference:
Young IT,
Quantitative Microscopy.
IEEE Engineering in Medicine and Biology, 1996. 15(1): p. 59-66.
Several sources of camera noise degrade the quality of the resulting image:
The Signal to Noise Ratio (SNR) of one pixel I(x,y) of a camera is then defined as:
SNR=20*log(I(x,y)/sigmacamera) (dB)
Although thermal noise,readout noise and quantization noise can be reduced to
a negligible level, photon shot noise is the limiting factor as it can never be
fully eliminated.
Which brings us to the ideal SNR for a given acqusition system.
SNRideal=10*log(I(x,y)/g) (dB)
I(x,y)/g is the number of photon induced electrons in the CCD element.
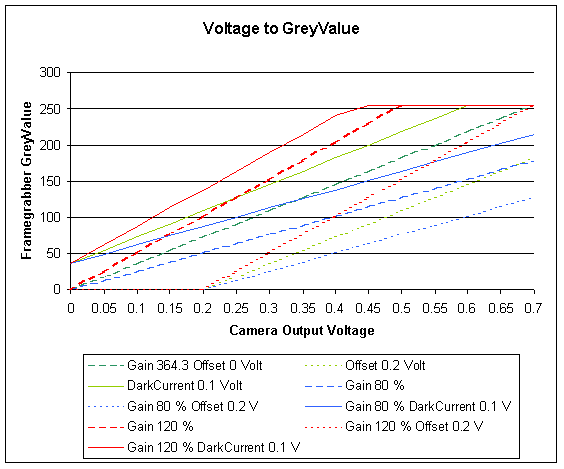
The relation of the analog voltage coming out of the camera
to the digital grey value coming out of the framegrabber.
PixelValue = 364.296 x Voltage (green curve).
The graph shows the artefacts, caused by a mismatch of the framegrabber
response to the output of the camera.
The framegrabber in the computer converts the voltage, coming out of the camera into a digital value. The analog voltage output coming from the camera, ranging from 0.0 (black) to 0.7 (white) Volts is converted in to 256 intensity- or greylevels (0 to 255 in an 8 bit A/D converter). The camera and framegrabber have to be adjusted to cover the entire dynamic range of the incoming light. The adjustment includes setting the gain (contrast) and adjusting the offset and darkcurrent (brightness).
The procedure to set the camera and framegrabber to cover the dynamic range of the preparation:
Losing image information due to gain (contrast), darkcurrent and offset (brightness) setting, can not be restored afterwards and will have a negative influence on the resulting data.
Hints and tips:
Changing the illumination is another way to adapt the preparation to the current
setting of the camera and the framegrabber. This can be done in brightfield microscopy
by inserting neutral density filters in the light beam illuminating the sample.
A prerequisite is of course that the camera and the framegrabber are capable to
cover the entire dynamic range of the sample.
The major use of image processing in conjunction with image measurement, is to correct
specific defects in the acquired image. The most common problems are associated with
noise in the original image, or nonuniform illumination or other systematic variation
in brightness. There are several methods for dealing with each of these.
In an ideal image, features which represent the same thing, should have the same
brightness no matter where in the image they lie. In some cases however the illumination
is nonuniform (microscope misalignment, Koehler illumination not set up properly) or
strikes the object at an angle.
When these effects are present, it is not possible to directly discriminate features to be
measured based on their absolute brightness. Different approaches are necessary, depending on
the situation.
A prerequisite for brightfield or darkfield background correction is a linear response
of the entire image acquisition system (camera, framegrabber). Notice that every deviation
from an even illumination will result (after correction) in loss of dynamic range and as such
a loss of contrast.
To correct a brightfield, transmitted-light image, use the following procedure:
Correction of image defects
Introduction
Background correction
Introduction
Another cause of variation lies in the image acquisition device, as there are
pixel-to-pixel variation in the CCD-camera and edge-center variations (vignetting).
The sample preparation may be another cause of shading. Many specimens viewed in the
microscope by transmitting light (eg. brightfield microscopy) are not uniform in density and
thickness. This causes an overall shading of the background brightness.
Brightfield
Transmitted-light images are created when the specimen is between the image sensor and
the light source. Put simply, light is shined through the image. Most brightfield microscopes
use transmitted light.
There are two types of background problems that occur with transmitted light images:
- variance in the brightness of the light source and
- reflected ambient light.
These problems are particularly troublesome if you need to extract accurate densitometry data.
To correct them you need to subtract the darkfield from the specimen image and divide by
the brightfield.
The notion is that you place image in a temporary buffer, then you can combine any image
from the buffer with the active frame using the necessary arithmetic operations.
Once you have adjusted the light, do not change it until you are finished collecting data.
Darkfield images are those which capture fluorescent or luminescent phenomena. Darkfield images sometimes have problems with electronic background noise. If this is the case, you can capture an image of the background and subtract it from each specimen image. To subtract a darkfield background, use the following procedure.
Localized background correction is necessary if the background changes throughout the
image but cannot be characterized by taking a bright or darkfield image.
For example, if you illuminate your sample with reflected lighting and the intensity
varies throughout the image. Or, if you are measuring cell nuclei and tissue thickness
background stain varies throughout the image. You can correct the background locally
using a local smoothing like a parabolic opening or closing.
Textured backgrounds can sometimes complicate feature identification and analysis.
You may remove textural backgrounds by computing a 2DFFT and editing the power spectrum.
If you do not need to remove a textured background but it is preventing you from
setting a threshold, you may temporarily remove the texture by dividing the specimen
image by an image of the textured background. You can then threshold and apply other
morphological techniques to find features of interest. After you have identified the
features, you copy back the original image and extract measurements.
Noise may be either random (stochastic, normal distributed or Poisson distributed) or periodic. Random noise is most familiar as snow in an image (Poisson noise). Pixels are either randomly increased or decreased in brightness compared to their proper value, or may be dropped out. Dropped out pixels are missing from the acquired image, and are usually set by the hardware to eiter the darkest or brightest value available (cold spots or hot spots on a CDD array).
Frame averaging is usually employed to increase the signal-to-noise ratio of low-light
images. The noise in such images is caused in part by the faintness of the subject
and by ambient electronic noise in the imaging system. Averaging reduces noise in
proportion to the square root of the number of image frames averaged. This means that
increasing the number of averaged frames from 4 to 16 halves the residual noise. To
halve it again would require 64 frames!
To perform frame averaging it is also important to have enough memory depth (bits)
to hold the sum of frames without overflow.
If you capture and analyze a series of images you will find that each image
contains the signal (image data) and a random pattern of noise. Because the noise is
random, you can remove its effects by averaging a series of images.
To average a series of images you must have a frame grabber and camera system that
support averaging or integration, or it may be implemented in the software package you
are using.
If you have such a system, enter the number of frames you wish to average in the
appropriate field of the image acquisition dialog box and activate frame averaging.
Spatial filters can be used to reduce noise. Averaging and gaussian filters can be
used to reduce normal distributed, i.e. gaussian, noise.
Averaging and Gaussian filters smooth images but have the
effect of blurring edges. They are often used as preprocessing filters before a
threshold operation to remove noise or intensity variances that preclude a good
threshold.
A median filter is more suiteable for removing shot noise (Poisson noise).
So for removing bright or dark spikes, use a median filter.
These filters replace the target pixel with the median value of its neighboring
pixels. While they serve to reduce noise, median filters do not blur edges as
significantly as the average or gaussian filters.
Some images contain periodic noise that impedes analysis. You can remove periodic noise by editing a two dimensional Fourier transform of the image. When you perform a forward Fast Fourier Transform (FFT) you view the power spectrum of the image. Here you can easily see the location of periodic noise. You can suppress it or remove it by cutting ranges or spikes using the editing or retouching tools. Once you have edited the frequency information, perform an inverse Fourier transform to create an image free of periodic noise.
There are currently two practical methods of acquiring very dim images. One is to amplify the image using an image intensifier, the other is to accumulate (integrate) the image over a period of time.
If the image is extremely dim, in the range of 103 to 105 photons/second/cm2, then an intensifier is the clear choice. This is because an intensifier is inherently more sensitive. If the image has a significant movement component, then an intensifier is again the clear choice because it is inherently faster. If the image light level is above 105 photons/second/cm2 and the image is stationary, then integration is the clear choice. If the image is moving, then intensification is necessary to prevent blurring from movement during acquisition.
Typically low light level fluorescent images available from a microscope camera port are in the range of 106 to 107 photons/second/cm2. The choice of imaging methods then reduces to whether the image has a significant movement component with respect to integration time. At these light levels, typical integration times to accumulate an adequate image can range from a hundred milliseconds to several seconds. The times are influenced by such factors as the susceptibility of the particular dye to photobleaching, the total length of time over which the observations need to be made, the quality of the microscope optics and the sensitivity of the particular camera. Movements of more than several pixels during integration will cause noticeable blurring of the image and result in loss of data from the image. Using a 40x objective and a 2/3 inch integrating CCD camera integrating for 1 second, movements of 10’s of microns can be a problem.
Intensifiers are expensive and they can be damaged by exposure to bright light. They have shot noise that increases with gain. It is random noise than can be removed by averaging several (typically 4 or 8) successive images together. However averaging can cause blurring of the image if there is significant movement with respect to the averaging time. Intensifiers come in two forms, separate intensifiers which can be mounted to a video camera or a unit combining the intensifier and camera into one unit.
Integration requires a synchronized trigger or gate, usually generated from an imaging program running on a computer. Cooling the CCD array improves the signal-to-noise ratio of integrating cameras. Most CCD cameras are capable of integrating.
I am indebted, for their pioneering work on automated digital microscopy and High Content Screening (HCS) (1988-2001), to my former colleagues at Janssen Pharmaceutica (1997-2001 CE), such as Frans Cornelissen, Hugo Geerts, Jan-Mark Geusebroek and Roger Nuyens, Rony Nuydens, Luk Ver Donck, Johan Geysen and their colleagues.
Many thanks also to the pioneers of Nanovid microscopy at Janssen Pharmaceutica, Marc De Brabander, Jan De Mey, Hugo Geerts, Marc Moeremans, Rony Nuydens and their colleagues. I also want to thank all those scientists who have helped me with general information and articles.
The author of this webpage is Peter Van Osta.
Private email: pvosta at gmail dot com